Posts Tagged ‘Going native on Crime’
Goals for Gusciora
Now that Reed Gusciora is Mayor and everyone seems to want to sing “Kumbaya“and forget how low he sunk to win the election, perhaps we can all rally around some measurable goals. After all, isn’t that what people naturally need in order “move forward” in the same direction.
I’ve had any number of people suggest that we need to all work together. But what does that even mean?
What is the work? What are we trying to accomplish? What are the best tactics towards reaching those goals? How do the 85,000 citizens of Trenton pitch in?
Unless someone can answer those questions, the next person that suggests we all work together, is likely to get slapped.
Work together doing WHAT?
My confidence that Mayor Gusciora ever provides “goals” for his administration is low, albeit not as low as the confidence I had in Tony Mack or Eric Jackson. It’s possible though. I know at least a couple of people on the transition team that know what a measurable goal is. However, I know that there are likely many others who would advise against setting goals.
But you know what, in some ways it’s too late. The Mayor has already made one big whopping campaign promise that can equate to improvements in three of the measurable goals we use to measure city success. Reed says he wants 1000 new homes in 1000 days. That’s pretty big. Improbable, but nonetheless big.
This is a different kind of approach to the one Doug Palmer had. The Palmer administration was always trying to hit home runs with big multi-million dollar projects that sounded impressive to voters. Unhappily, by swinging for the fences all the time he struck out all the time and even hit some foul balls that injured people (the hotel).
1000 homes in 1000 days is more like trying to hit a bunch of singles. He may not hit a 1000 but if his approach works at all maybe he hits 500, which is about 500 more than Palmer.
But what about the real goals that matter and objectively measure our success? ReinventTrenton and other groups use the following:
- Crime levels as measured by the Uniform Crime Report
- Population growth as measured by the U.S. Census Bureau (in the case of Trenton, every year)
- Graduation rate as measured by the NJ Department of Education
- Median Household Income as measured by the U.S. Census, and
- Economic success as measured by our Tax Base
Let’s start with the three that Reed is sort of talking about: Population, Tax Base and Household Income.
Adding 1000 homes is a big goal but to measure the impact we need to make some assumptions. First, what home price is necessary for the city to break-even between property taxes and costs to serve the property owners. For Trenton, a house needs to be about $200,000, that’s somewhat lower than the average for Mercer County. Let’s assume Reed does the right thing and targets $200,000 as the average price for these homes.
Tax Base
Trenton’s tax base is $2,395,945,829. Given the home price assumption, 1000 x $200,000 equals a $200,000,000 increase in our tax base. His goal should be $2,395,945,829 + $200,000,000 or roughly $2,600,000,000 ($2.6 Billion).
Population
Our current population is 84,964. If 1000 new homes were added averaging, let’s say 2 people per home (just under Trenton’s average of 2.2). 1000 homes at 2 people per house equals 2000 new citizens. Reed should have a goal of 87,000 residents. That would be a healthy turnaround of 2.3% and above the growth rate for the State of New Jersey.
Household Income
Trenton’s current Median Household Income is $34,415 over 34,654 housing units (both houses and apartments). To buy a $200,000 home, a household income will need to be at least 1/3 the value of the home, or $67,000 but let’s call it $70,000 to make the math easier. If 1000 homes were added with an average household income of $70,000, the city-wide average could go up to reach a goal of $35,413, an increase of 2.9%.
The next two goals aren’t as dependent on the 1000 new homes, so perhaps Mayor Gusciora’s goals should simply reflect improvement trends over the last year.
Crime
Our Uniform Crime Reports for 2017 are 3276. This was down just over 1% from 2016. If that trend continues Mayor Gusciora should be able to achieve a 4 year goal of 3147 by 2021 or a 1% yearly decrease.
Graduation Rate
The 2017 graduation rate was 70.14%, an increase of almost 5 percentage points over 2016. That kind of improvement isn’t likely for 4 years straight, but he does get the benefit of a shiny new high school. Without doing a lot of complicated trend analysis, I’ll simply throw out a goal of 80% by 2021. Hamilton and Ewing are around 90% so this isn’t quite the average we need but it would be good progress.
It’s not important that the Mayor and his team adopt these exact goal values, but it is important that they express some measurable goals to the citizens of Trenton. Maybe the Mayor thinks graduation rates could be 85% or only 75%. What matters is there is a number goal. I strongly suggest that these measures are used as they are publicly available, well understood and published by reputable 3rd party sources.
If we don’t see goals published by the Mayor and agreed to by City Council, then reasonable citizens should question the dedication and ability of the new government to turn the city around?
We all know Trenton is in Rough Shape
Now that Mayor Jackson has taken office it’s squarely on his shoulders to not just talk but to show results in improving Trenton.
We all express our displeasure differently. Residents, business owners and those considering a move to Trenton say it in many different ways:
- “Things have gotten bad”
- “Restaurants are moving away”
- “Trenton used to be great”
- “My taxes are killing me”
- “It’s not safe anymore”
We all have emotional responses to the situation we’re in and it’s difficult to put our finger on what bothers us most.
If we really think about it though there are five key indicators of Trenton’s health. Five symptoms that show how well we’re doing. And if all five of these indicators started showing signs of improvement, all Trentonians would notice the city coming back to life. If we could see progress in these five areas we’d have hope again that would be contagious.
The indicators are all well-known statistics that are easily and regularly measured in Trenton. They are:
- Crime levels as measured by the FBI’s Crime Index
- Population growth as measured by the U.S. Census Bureau (in the case of Trenton, every year)
- Graduation rate as measured by the NJ Department of Education
- Median Household Income as measured by the U.S. Census, and
- Economic success as measured by our tax base
To be a successful Mayor, Eric Jackson must lead Trenton to show progress on these 5 measures. It’s not nearly enough to say “I’m working hard”. Mayors have said that before and the problem was they were working on the wrong things. Doing the smart thing is much more important than working hard on the wrong thing. Over the next several years I plan to do my part by reporting to Trentonians on Mr. Jackson’s progress on these basic measures. I’m looking for results not promises of results.
The following is my initial report.
Our people are leaving the city
Trenton’s 2012 census estimate is 84,447 residents
The most important measure is the simplest one, is Trenton such an attractive place to live that our population is growing. Unfortunately the current answer is NO.
- Since 2000 our population has declined by 1.2%
- Meanwhile New Jersey’s population has grown 5.4% in the same period
Relative to our neighbors, Trenton has become a less desirable place to live. Over the past 44 years Trenton has steadily under-performed with the State growing 43% faster than Trenton.
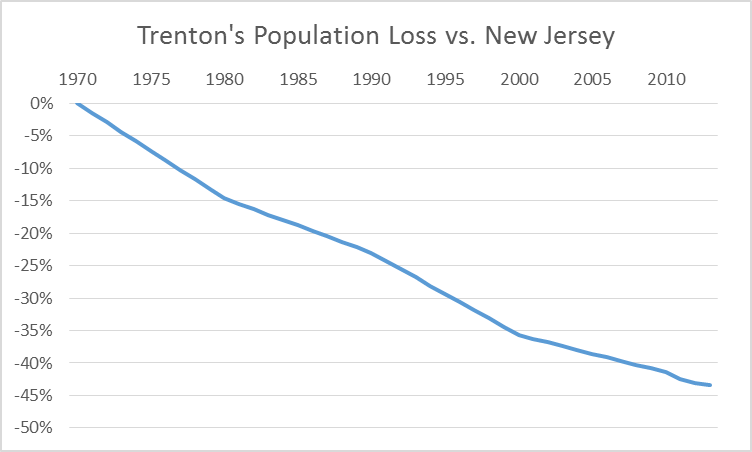
While New Jersey’s growth has accelerated Trenton’s population has shrunk. We benefit from the same factors that drive growth in the state so it is especially disappointing that Trenton continues to lose people. Some have pointed out that Trenton’s population loss has slowed, but that is blatantly misleading. It has only slowed because New Jersey’s growth has accelerated.
It will take an influx of new residents to begin the process of rebuilding our tax base. We have room to grow. At its peak in the 1920s, Trenton housed 140,000 residents.
Our economy is losing wealth
In 2011 Trenton’s tax base, the value of property on which we can charge a property tax, was $2,009,731,470. By 2014 it has declined to $1,993,783,800. This represents a .8% loss in ratables for the city.
The implications of this statistic are large. It means our economy is getting worse instead of better and most importantly, it means that our policies are not working.
We can never have a lower tax rate or afford to spend more money on parks, police and streets unless our ratables go up.
Our incomes are relatively low
Trenton’s Median Household Income is $36,727 (2012)
- This is in stark contrast to NJ’s median household income of $71,637, which is almost double that of Trenton’s.
- Hamilton’s median household income is $72,735
Worse yet, the percentage of households in Trenton with income over $200,000 is 1.6%,
- The compares poorly to 9.1% for New Jersey and 4.3% for Hamilton
- High income households spend money on amenities at a much higher rate than low income
Income levels are very important to the health of a city as they determine how much money residents will spend, which in turn, determine the attractiveness of a city to retailers and other amenities. While NJ’s median household income is double that of Trenton’s, NJ’s per capita retail spending is three times our rate. This means that retail spending falls off disproportionately to income.
Making Trenton attractive to retail and entertainment business is important as the presence of those amenities makes the city attractive to new residents and businesses but we won’t get new amenities without more spending power in the city.
Our children are dropping out of school
The Trenton school district’s 2013 graduation rate was 48.6%.
- This means that almost half of the students who entered 9th grade in 2009 graduated in 2013.
- There is no world in which this is healthy.
- It can be argued that fixing the schools isn’t a prerequisite for revitalizing the city. The easiest target market for new residents is the millions of people without kids. However, failing schools don’t help.
With 50% of our young adult population grossly under-educated, they are likely to become a drain on the economic future of our city. High school dropouts are more likely than graduates to turn to crime and create a social cost for the rest of us.
The cumulative effect of moving the graduation rate up to 75% could halve our crime problem in the long run if the correlations between dropout rate and crime follows.
Our crime rate is still high
Trenton’s crime problems have tracked the national trend downwards over the last decade.
Uniform Crime Reports for 2013 are 3443
- This is a decrease from 2012 of 14% which shows we’re moving in the right direction,
- However in 2013, Trenton set a murder record of 37 which placed it among the most dangerous cities in America.
- Meanwhile neighboring Hamilton had a crime index 2057 and only 1 murder in 2013.
There is a direct correlation between population decline and crime
In “CRIME, URBAN FLIGHT, AND THE CONSEQUENCES FOR CITIES”, economists Julie Berry Cullen and Steven D. Levitt found that each FBI index crime leads directly to one person moving out of an inner city, like Trenton. That’s bad enough but high income residents are 5 times more likely to leave due to crime than average. Families with children are 3 times more likely to leave. Finally crime rate is negatively correlated with depopulation, home values and per capita income.
These conclusions alone are quite damning for Trenton. However, it gets worse. If a city becomes depopulated, the crime rate goes up because the criminals stay behind. Also, because high income people leave, poverty becomes more concentrated.
We don’t have a lot of flexibility in our budget to fix things
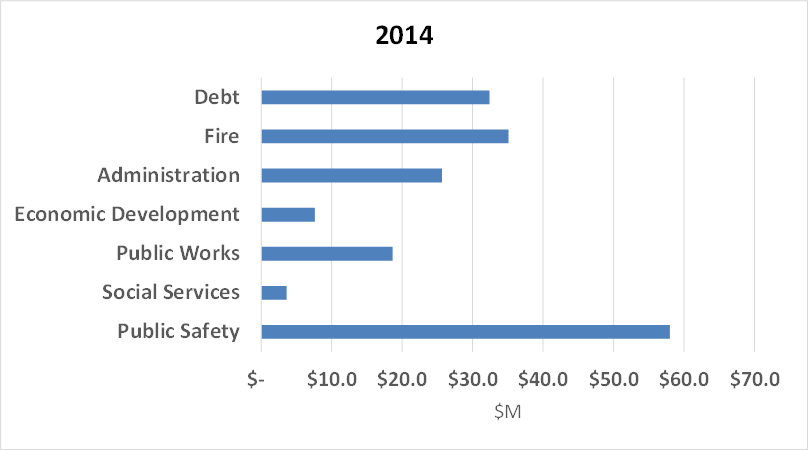
Our expenses can’t change much
Debt, fire and police make up almost all of the budget and other functions are cut to the bone.
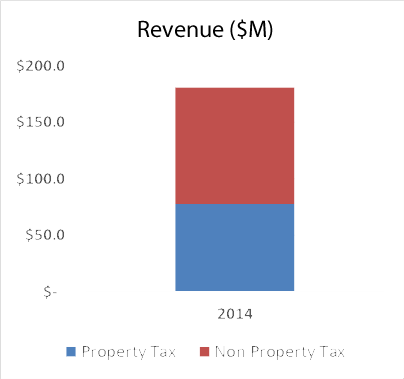
Our revenues can’t change much either
Property tax makes up less than half of our budget so any change in the budget will have a large effect on taxes.
This is a complicated problem
A city is a complex system. When dollars are invested in crime fighting in one part of the city, street paving may go undone in another. That lack of street paving may have a larger or smaller impact on investment in the city than the crime fighting.
Investment will lead to a higher tax base but not for some time. In the meantime, there may not be enough money to fund basic services and taxes have to be raised.
Higher taxes will devalue the investment, leading to lower than anticipated increases in the tax base.
And so it goes in any economy. 1st and 2nd order causes and effects are at play making seemingly simple policy decisions difficult. This is especially problematic in an environment where the public doesn’t appreciate the non-intuitive nature of such decision-making.
How can we turn this city around?
We’re in a vicious cycle
- High crime leads to depopulation and greater expense in policing
- Depopulation leads to higher taxes which drives people away faster
- In a city where almost half of its budget is fixed on debt services and benefit obligations, our ability to fund discretionary budget items such as city services is limited
- Lack of services drives people away even faster thus creating a vicious cycle.
How can we turn a vicious cycle into a virtuous circle?
- A virtuous circle is the opposite of a vicious cycle
- Good things build on one another
- Eventually enough good things happen that they overwhelm the bad things and the city grows despite itself
- This is happening in some cities in America like New York and Washington and even New Brunswick and Jersey City
Mayor Jackson will do well to ask himself every time a program or initiative comes across his desk, “How will this move the needle on these five basic measures of a city’s health?”
Causes and Effects: A Guide to disciplined policy discussion
The world is made up of causes and effects. Hurricanes cause storm surges. Hitting a cue ball hard into a break causes pool balls to scatter. A bad earnings report causes a company’s stock to go down. And so it goes in business, sports, life and cities. High crime rates cause visitors to stay away from a city. High taxes slow development. High college acceptance rates attract students to schools. This is what economists spend their time thinking about.
Most people think about these causes and effects abstractly. Common sense tells them that one thing ought to affect another. For instance, an after school program keeps kids off the streets and therefore should reduce the crime rate because kids on the streets sometimes commit crimes. Another example might be, making a city’s inspections process less expensive to lower development costs and stimulate investment. Or perhaps, opening a new museum will increase tourism.
Most people are comfortable making statements like the above, but generally don’t know the details. For instance, they can’t answer questions like: If we spend $1,000,000 on foot patrols how many FBI index crimes will be avoided? Or, if we lower inspections fees by 50%, how much incremental investment should the city expect to see over the next 5 years? These are fair and important questions. Most citizens can come nowhere close to answering these types of questions, and that would be OK but sadly, most policy-makers in a city like Trenton can’t answer them either.
So how can normal citizens get better at thinking through the policy issues that face us every day?
Without researching every policy assertion that’s ever made, how can we begin to really understand causes and effects?
We make better choices by knowing whether a policy has a 1st order or 2nd order effect and whether the effect is strong or weak. Of course we need to start with clarity on our goals (investment, crime, education, population, income). But after being clear on goals we must carefully consider causes and effects so we can begin to decide whether policy assertions are important. This kind of thinking is often called “systems” thinking and is used to better understand complex things, like cities.
There’s a difference between 1st and 2nd order effects
In pool, when the cue ball strikes another ball and knocks it directly into a pocket, we call that a 1st order effect. One thing caused another. However that same pool shot may have left the cue ball well positioned to allow the player to sink the next ball. That’s a 2nd order effect. The difference is that in order for the good “leave” to have happened, many more effects of physics had to take place over and beyond the just hitting the first ball in. The cue ball had to be deflected just so, the spin had to be just right and perhaps the cue ball needed to bounce off the bumper with just the right angle. The good “leave”, assuming it was intentional, had a much less likely chance of success than hitting the first ball in.
And so it is with city policies. An afterschool program will most definitely get some kids off the street. Getting kids off the streets is a 1st order effect and can be measured fairly simply. It’s the number of kids in the program minus the percentage of those kids who would have otherwise stayed at home or in the library. For instance: of the 100 kids in the after school program we might say 40 of them would have been home. So the program got 60 kids off the street.
But how does an after-school program affect crime? It’s not likely that a kid staying home would cause a crime. But what about the 60 who would have hung out on street corners. It’s a bit harder to say because crime reduction is a 2nd order effect. For example, not all of those 60 kids would have ever committed a crime. Of the several who might be inclined to commit a crime they might do it when they weren’t in the after-school program. But then again, maybe the program has a long term effect on the child, or maybe it doesn’t. As you can see, the 2nd order effects begin to get murky. This is why sophisticated policy makers don’t depend on them and often point to 2nd order effects as “potential side benefits”.
In Trenton, we shouldn’t base our important policy decisions on 2nd order side effects.
Strong vs. weak effects and the importance of context
Even when causes and effects are 1st order, the linkage between the two can be weak. For instance in buying a used car, high mileage may not dissuade you from buying it. This is a 1st order effect but not a strong one because you’ve already decided you could accept a few miles on the car. However, dented side panels may just completely turn you off. The big dents might be a strong 1st order effect and keep you from buying the car.
It’s the same with public policy. Let’s return to inspection fees for a new home. Let’s say we want to stimulate growth by reducing the fee from $1000 to $300. That’s a big drop. And because it directly affects the price of the house, it’s a 1st order effect. However, that $700 drop in cost is fairly small in comparison to the $300,000 that you’ll eventually spend on the house. Other things like lumber, labor, land and property taxes easily dwarf the inspection cost. So while the reduction in inspection fees may be annoying to the builder, it has a weak effect (though 1st order) on the eventual buyer.
2nd order effects can be weak and strong as well. For instance, we can imagine a school retention program that lowers the high school drop-out rate. This program might have a good 1st order effect on education but also a 2nd order effect on crime reduction. That 2nd order effect might be considered strong because we know there’s such a high correlation between high school graduation and likelihood of committing a crime in the future. Compare that to an after-school basketball program which should have a 2nd order effect on crime reduction (as we discussed above) but that effect may be weak. Certainly the research and evidence linking graduation to crime reduction is stronger than that linking basketball to crime reduction. That’s not to say there’s no effect, it’s just not likely to be as strong.
The cause and effect of crime also varies widely. Economists have shown that each incremental index crime in a city leads to one person moving away. However, the rate of emigration is 5 times higher for high income people and 3 times higher for families with children. Poor, single people are much less likely to move away due to a high crime rate. Therefore we can say that a high crime rate has a strong effect on high income people leaving a city but a weak effect on the poor leaving (likely because they have fewer choices).
Just understanding this differences in the effects of crime, even in the abstract, should have a profound impact on how we think about policy in a city like Trenton. Sadly, you’ve never heard a government official make the above distinction.
It might be good to focus on strong 1st order effects rather than weak 2nd order ones.
In the world of policy making and particularly in a cash-strapped city like Trenton, we need to make hard choices. We don’t have either the money or the man-power to do everything we’d like. So it’s important for citizens to lobby for the most important policies and for government officials and activists to help clarify 1st and 2nd effects and strong vs. weak linkages.
We can use crime reduction as an example of a good objective. Criminologists know that high rates of incarceration have a beneficial effect on the crime rate (most people get this). There is a strong 1st order cause and effect between building good cases against criminals that lead to long sentences. On the other hand, we may spend the same money we would have spent on an extra detective on a mentoring program. The mentoring might have a 2nd order effect on crime reduction and likely a weak one at best.
When we talk about programs and policies in Trenton politics, we need to keep these things straight and always keep our core goals in mind as well as cost-benefit.
Policies that have multiple 1st and 2nd order effects are generally more impactful than others
Finally we should remember that sometimes policies can have multiple effects. You’d likely trade a $1,000,000 program to reduce crime that has single strong and effect on the crime goal, for a $1,000,000 program to stimulate development that might have a strong 1st order effects on the economic growth goal, a strong 2nd order effect on the crime goal and a weak 2nd order effect on the education goal. Some policies give us broader “bang for the buck”.
Policies that positively affect multiple goals in Trenton (investment, crime, education, population growth and income growth) will not only strengthen the city and stretch our dollars, but will find broader political support.
Every minute of every day, Trentonians have policy discussion on Facebook, at barber shops, in civic association meetings, over drinks and at City Hall. We discuss crime, trash pick-up, taxes, parades and any number of topics. It’s important for Trentonians to move past sentimentality and misguided assumptions in our discourse. We need to get on the same page. To do that, not only do we need shared goals, but we need a common vernacular for discussing policy. To the extent we can begin to discipline our thinking by keeping our goals clear and then breaking causes and effects down into 1st and 2nd order and then strong vs. weak, we’ll have a more constructive civic dialogue.
Note: I wrote this article for my blog 2 weeks ago, before the TESC deal for Glen Cairn Arms came up and was having it edited. I had no way of knowing we would be having a important policy debate about this very subject. I held off publishing it in favor of reporting on and providing thoughts about the proposed TESC deal. However now is a good time to start talking about causes and effects in policy discussion.
Crime budget questions we need answered
If you ask a Trentonian about their number one city issue, crime will probably come up. Yet we don’t really seem to have any clue about its measurable affects on our city or how to manage them.
Previously, I wrote about the cause and effect of a city’s crime level and it’s immigration level ( How Crime Affects Trenton). However, this is a very small part of the story. First, we have to agree on what it is about a city that we’d like to improve. In general, the best measure of a city’s health is its per capita income. Cities with high crime rates have low per capita incomes and vice-a-versa (The Economics of Crime).
How crime affects Trenton
All Trentonians know that our high crime rate isn’t good for the economy. However, not many of us know just how bad it is. It turns out that economists have studied the subject and have asked themselves that very question.
In “CRIME, URBAN FLIGHT, AND THE CONSEQUENCES FOR CITIES”, economists Julie Berry Cullen and Steven D. Levitt worked through quite a bit of crime, census and other data in addition to third party research to build up an econometric model of the effects of crime. It’s worth noting that Steven Levitt later went on to write Freakonomics which is referenced in my earlier article on the economics of crime.
I’ve provided a link to the article but I’ve summarize it fairly simply below. I’ll warn readers of the report in advance that this is an academic paper and some of the conclusions it draws are a bit disturbing to the politically correct mind. Read the rest of this entry »
The Economics of Crime
One of, if the not the biggest thing holding back revitalization in American cities is crime.
The facts speak for themselves – cities with high crime rates generally have poor growth rates. Cities that have somehow improved their crime rate do much better.

New York and Washington, DC are great examples of cities that have aggressively attacked their crime issues and have unleashed unprecedented economic growth. Washington used to be the most dangerous city in America and New York was supposed to be leading the country into chaos.
Looking just at New Jersey, two cities, New Brunswick and Newark are overcoming their crime issues and generating positive population growth. Meanwhile, Asbury Park, Trenton and Camden continue to scare their populations away.
Lot’s of people have lots of things to say about crime. The police say they do all they can and blame the courts for a revolving door justice system or the public for not cooperating. Children’s advocates blame lack of after-school programs. Civil rights leaders blame racism. Parents blame everybody and Bill Cosby blames parents.